Plan better transit networks with live GTFS intelligence.
Explore GO Transit routes, compare schedules, sketch service changes, and simulate network flow — all in one browser-based workspace.
- GO Transit routes
- 45+
- GTFS-based routing
- Live
- Planning modes
- 4
- Route variants
- 250+
- No install required
- Browser
Product
One workspace for the entire planning lifecycle.
Explore real GO Transit data, design new routes, analyze schedules, and simulate network flow — without switching tools.
Route Explorer
All 45 GO lines on a live map. Real stop sequences, headways, and GTFS trip data.
Schedule Comparison
Inspect timetables, compare headways across lines, and identify service gaps.
Service Updates
Live alerts from GO Transit — delays, cancellations, and notices, filterable by line.
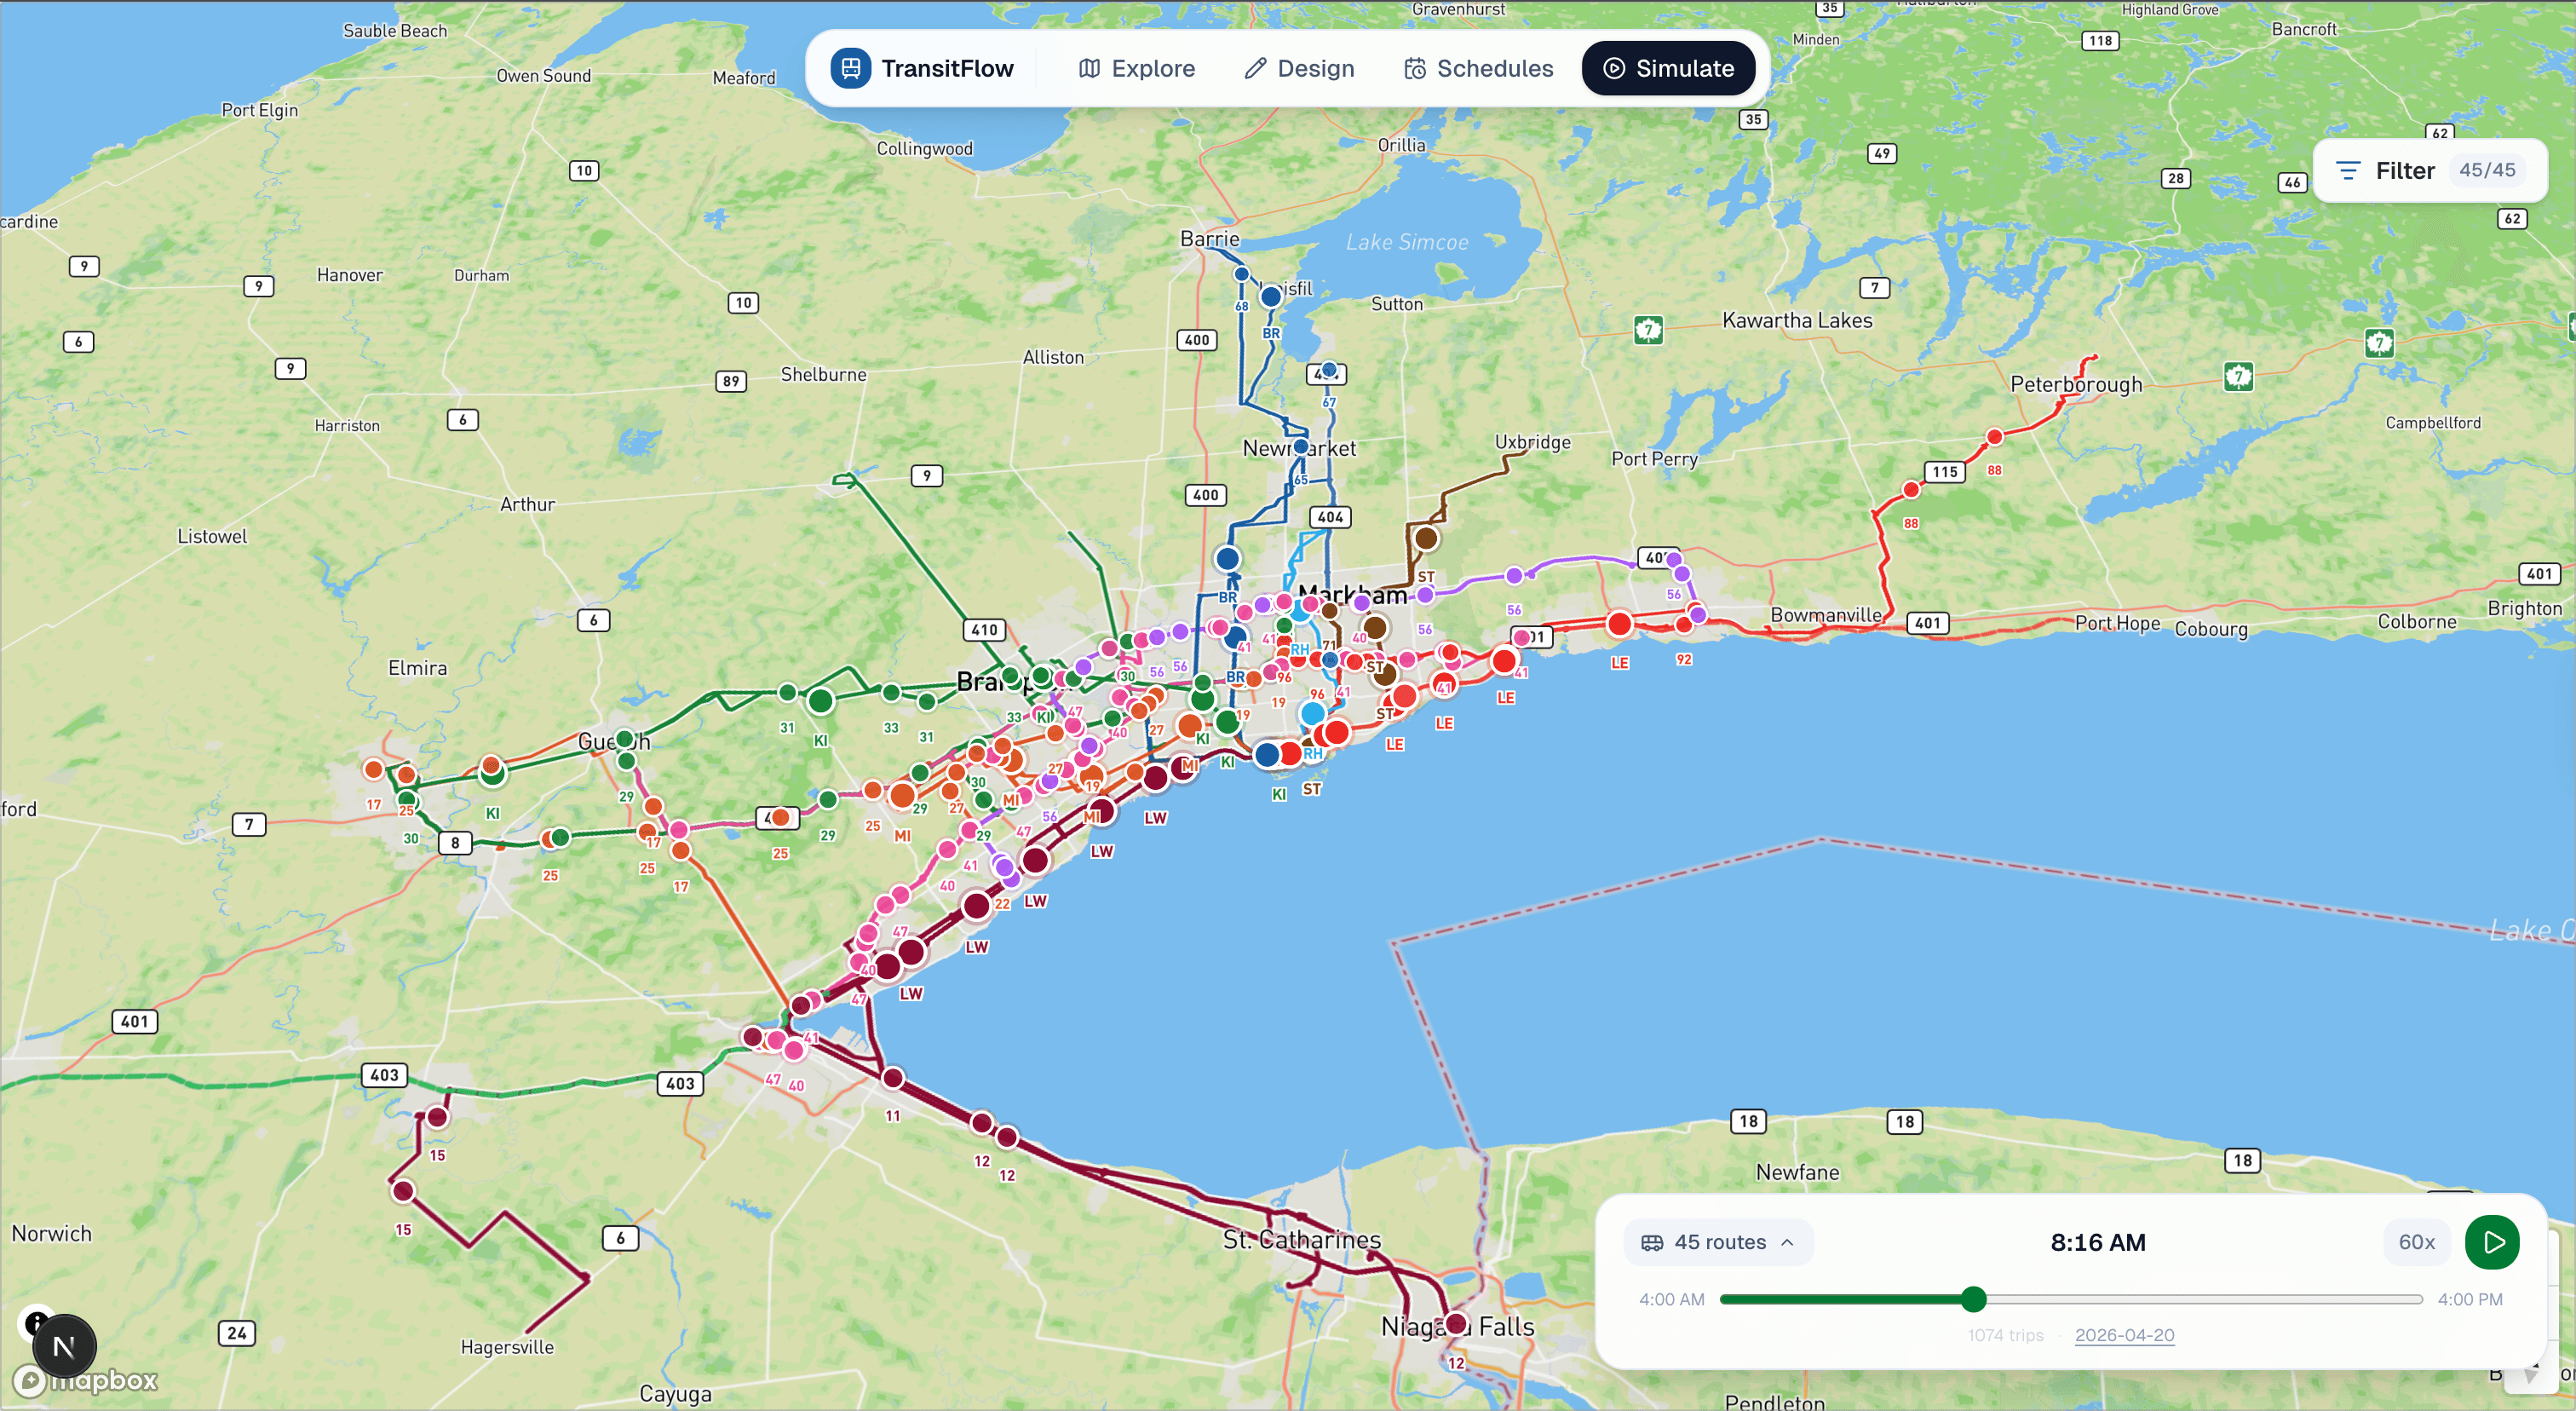
Simulation HUD
Animate the entire network or a single custom route. Scrub through any hour of the day.
How it works
From first open to full simulation.
Connect GTFS data
The full GO Transit network loads instantly — stops, trips, shapes, and frequencies — derived from the live GTFS feed.
Explore routes visually
Browse any of the 45+ routes on an interactive map. Click a line to inspect its stops, trip count, and corridor.
Compare service patterns
Switch to Schedules mode to compare headways across lines or examine departure times at any stop.
Simulate network changes
Draw a new route, set its schedule, then watch it run alongside the live GO network in the simulation engine.
Core capabilities
Everything a planner needs. Nothing they don't.
GTFS-powered route intelligence
Derived GeoJSON and stop data from the official GO Transit GTFS feed. Always accurate, always structured.
Interactive route sketching
Draw corridors on the map, snap to the rail network, place stops, and wire up a full schedule in minutes.
Schedule and departure analysis
Inspect any line's timetable, compare peak vs. off-peak headways, and surface gaps in coverage.
Service update visualization
Live GO Transit alerts delivered directly into the workspace — filterable by line, categorized by severity.
Simulation-ready transit data
The simulation engine animates vehicles across the real network — or any custom route you design.
Planner-friendly map workspace
One browser tab. Four modes. No GIS software, no install, no account required to start exploring.
Use cases
Built for people who think in networks.
Evaluate service changes before they ship.
Sketch a new route, compare it against the existing network, run a simulation, and share the result — all in one workspace.
Study real networks with real data.
The full GO Transit GTFS feed, structured and queryable. Ideal for urban planning coursework, network analysis, and thesis research.
Build on live GTFS without the overhead.
Pre-processed GeoJSON, derived stop data, and a simulation engine — open source and ready to extend.
Communicate proposals visually.
Generate shareable map views of proposed service changes. Show the community what a new route looks like before a single dollar is spent.
Why TransitFlow
Built for exploration, not static maps.
Most transit tooling is built for consumption, not planning. TransitFlow is the workspace the others don't offer.
| Feature | TransitFlow | Static PDF maps | Spreadsheet planning | Disconnected GIS tools |
|---|---|---|---|---|
| Live network data | ||||
| Route design tools | ||||
| Schedule analysis | ||||
| Simulation engine | ||||
| Service update alerts | ||||
| Browser-based | ||||
| Free to use |
Start exploring the future of transit planning.
The full GO Transit network — live GTFS, a drawing canvas, schedule analysis, and a simulation engine — free in your browser.